About us


What is Voilà?
- Turns your Jupyter Notebooks into interactive dashboards
- A very simple CLI interface e.g.
voila notebook.ipynb, no change to your Notebook required! - An extensible templating system based on Jinja
voila demo
Customize your dashboard !
Reveal template
voila --template=reveal my_notebook.ipynb
Make slide shows with Voilà! Note that this presentation uses reveal.js 😉

Vuetify template https://github.com/voila-dashboards/voila-vuetify

Make your own! 🚀
You can build your own Voilà template using Jinja
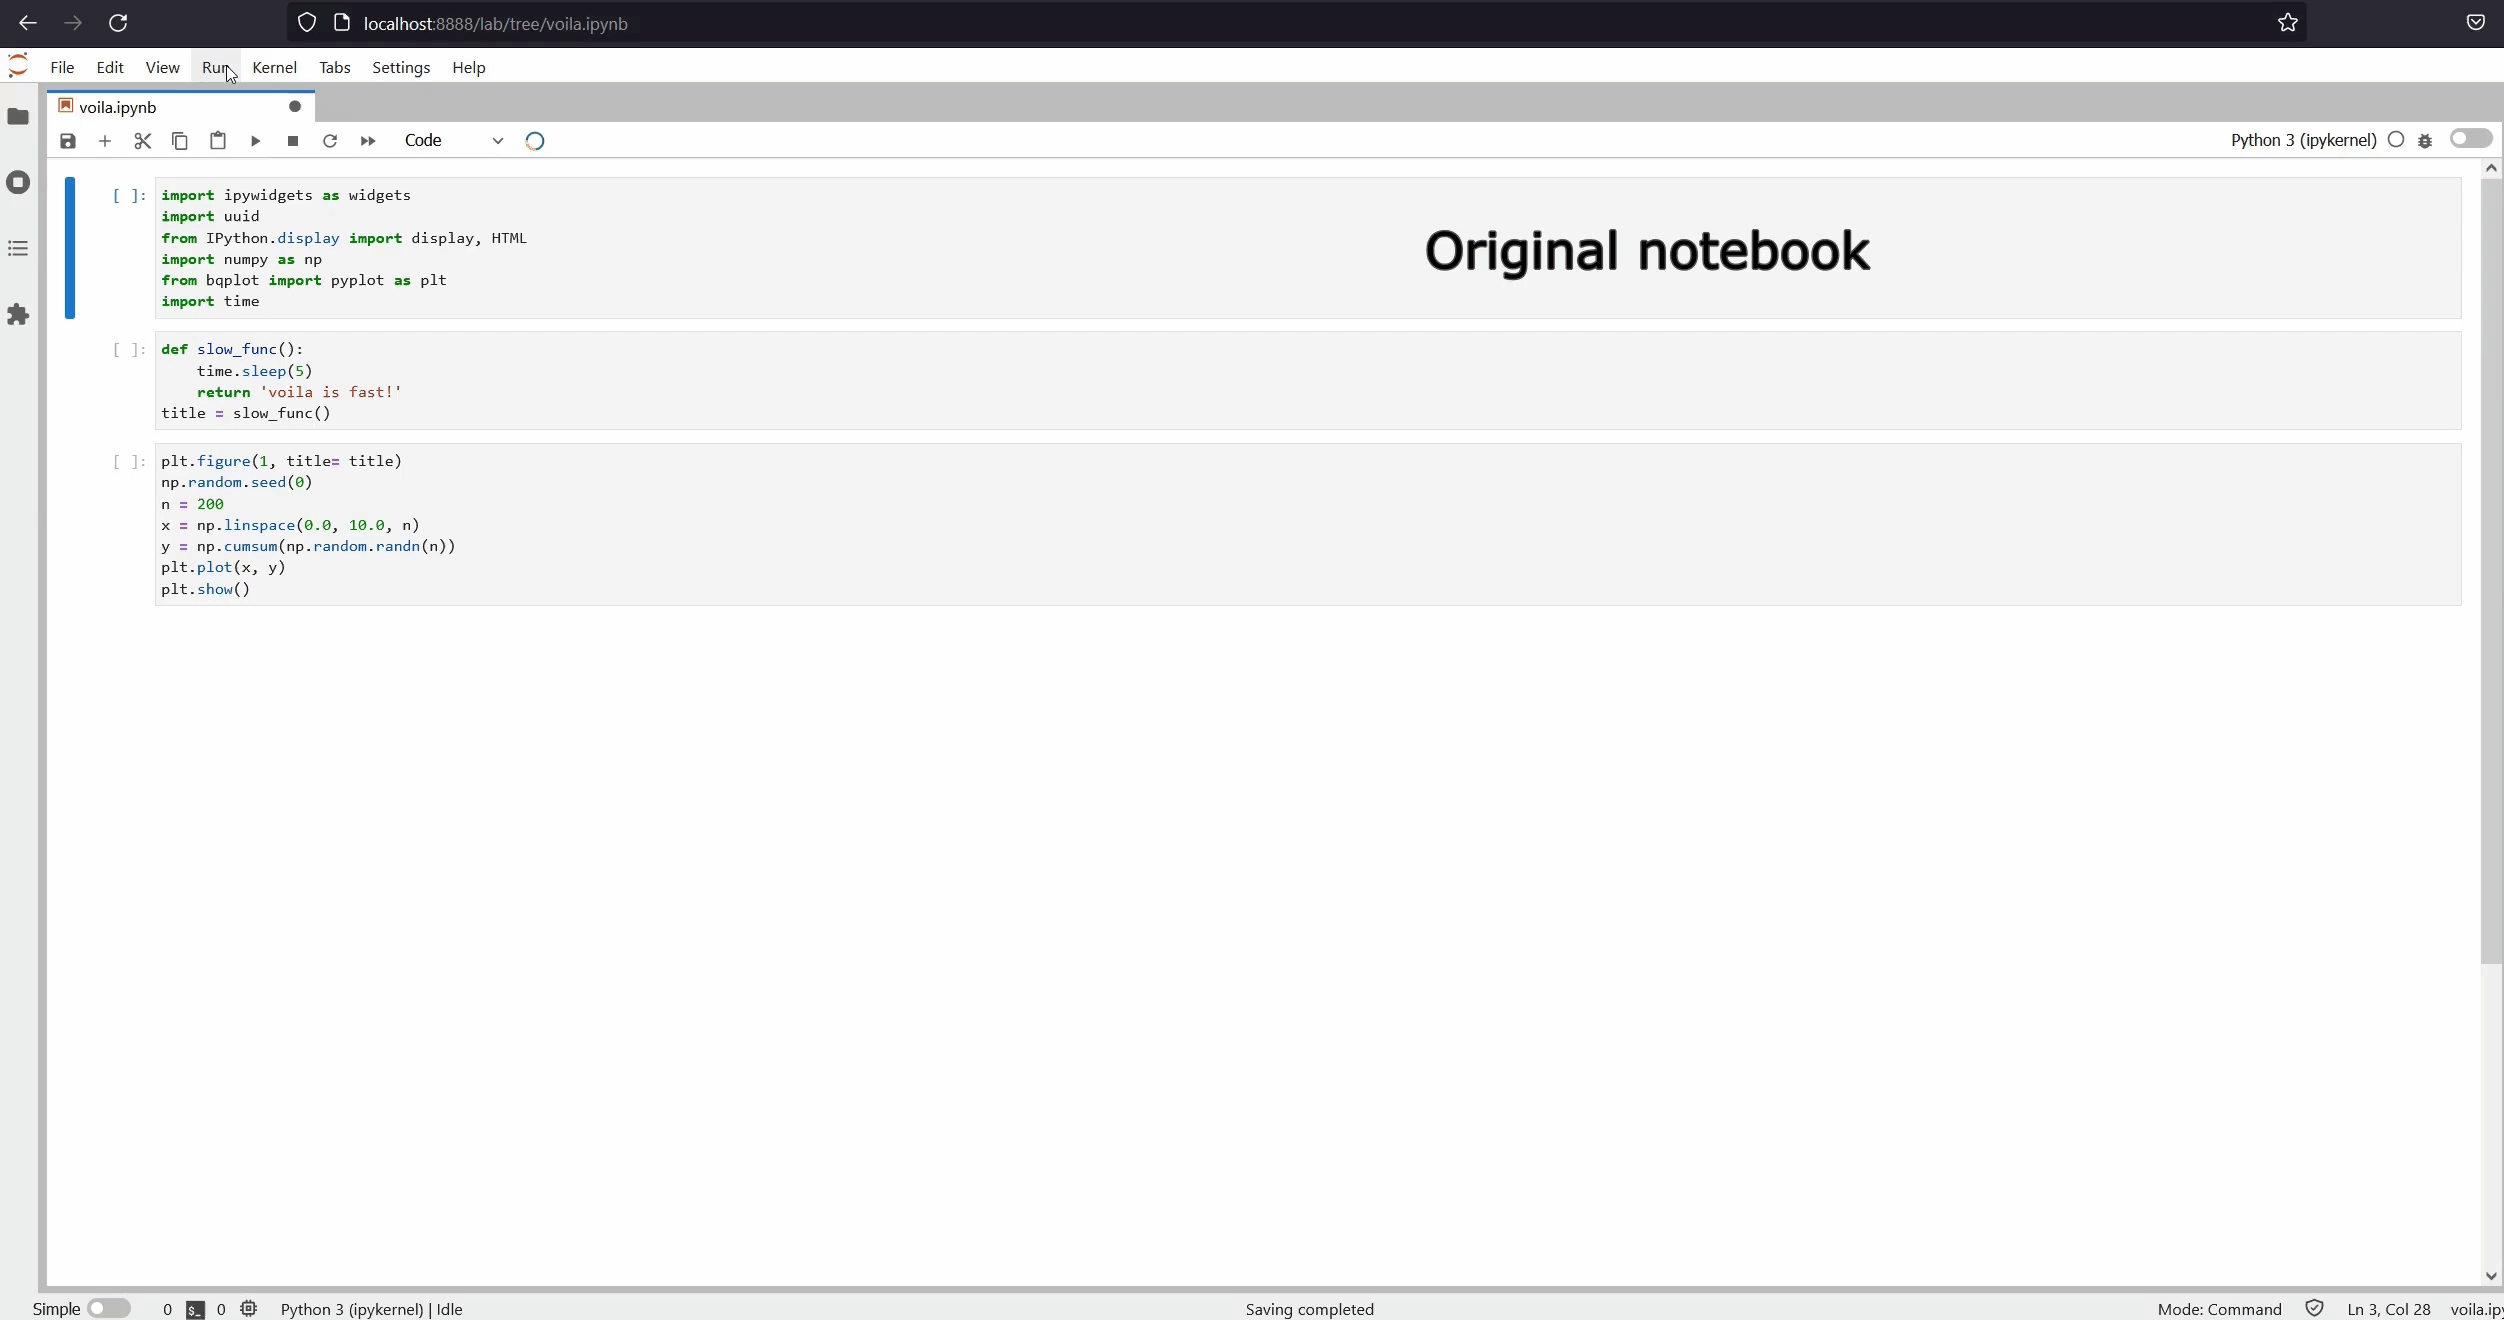
Pre-heated kernels
Voila with normal kernels:

Pre-heated kernels: move the resource intensive tasks to the startup time


Voilà 0.5.0 is coming ! 🏁
What's new?!
- Similar to the ongoing Jupyter Notebook v7 work: A front-end closer to the JupyterLab ecosystem!
- Making use of the JupyterLab mimerendering logic: Support for custom JupyterLab renderers (fasta, vega, geojson, bokeh, and many more!)
- Jupyter server v2 support
About JupyterLite 💡
JupyterLite is a JupyterLab distribution that runs entirely in the web browser, backed by in-browser language kernels.
About JupyterLite 💡
How to use Voici:
Available on
PYPI, soon to be on conda-forge.VoiciCLI :voici my-notebook.ipynbSupport the same arguments and options of
Voila: templates, themes,...
Voici vs Voila:
- Code execution:
Voilauses real kernels running on the server.Voiciuses WASM based kernel running on the browser.
- File and network access:
Voiladirect access.Voicifile access through service worker, network access can be blocked by CORS.
- Code cells exposure:
Voilacode cells can be hidden completely.Voiciusers have access to the code source of the notebook.
This presentation is a Voici dashboard!
https://github.com/martinRenou/voici-jupytercon-2023
https://martinrenou.github.io/voici-jupytercon-2023/voici/render/main.html

Simple code execution
In [ ]:
import this
In [ ]:
import pandas as pd

df = pd.read_csv('iris.csv')
df
ipywidgets with Python callbacks execution in the page
In [ ]:
import ipywidgets as widgets

slider = widgets.FloatSlider(description='$x$')
text = widgets.FloatText(disabled=True, description='$x^2$')

def compute(*ignore):
    text.value = str(slider.value ** 2)

slider.observe(compute, 'value')

slider.value = 4

widgets.VBox([slider, text])
Visualization libraries support
In [ ]:
from ipyleaflet import Map, basemaps, basemap_to_tiles

m = Map(center=(50.67, -1.28), zoom=10, basemap=basemaps.OpenStreetMap.Mapnik)
m.add(basemap_to_tiles(basemaps.Strava.Water))
In [ ]:
from ipydatagrid import DataGrid
from datagrid import renderers
from requests import get
import json
# Load online resource
request = get('https://raw.githubusercontent.com/bloomberg/ipydatagrid/main/examples/cars.json')
data = json.loads(request.content)
df = pd.DataFrame(data["data"])
df = df[sorted(df.columns)]

datagrid = DataGrid(df, base_row_size=32, base_column_size=150, renderers=renderers)
datagrid
In [ ]:
%matplotlib widget

import matplotlib.pyplot as plt
import numpy as np

fig = plt.figure()
plt.plot(np.sin(np.linspace(0, 20, 100)));
In [ ]:
import altair as alt
import numpy as np
import pandas as pd

x = np.arange(100)
source = pd.DataFrame({
  'x': x,
  'f(x)': np.sin(x / 5)
})

alt.Chart(source).mark_line().encode(
    x='x',
    y='f(x)'
)
Use Voici in Sphinx documentation 🗎
Using https://github.com/jupyterlite/jupyterlite-sphinx, it will soon be possible!!